We Create Your
Power BI Dashboards
The best dashboards. Fast. Reliable.
With no strings attached.
Here's how it works
Tell us your business needs
We model
your data
We create your dashboards
Dashboard examples
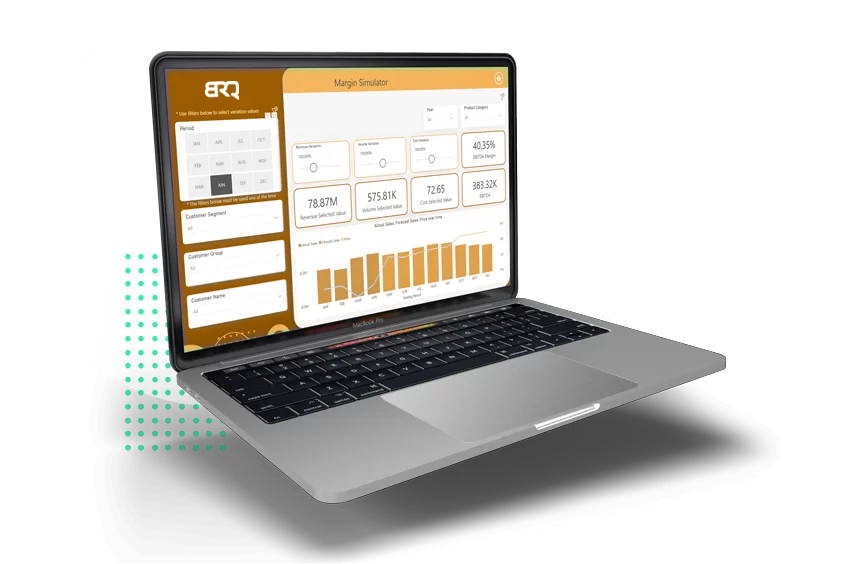
Finance
Dashboard made for the financial segment, including margin simulation, revenue variation, price forecast.
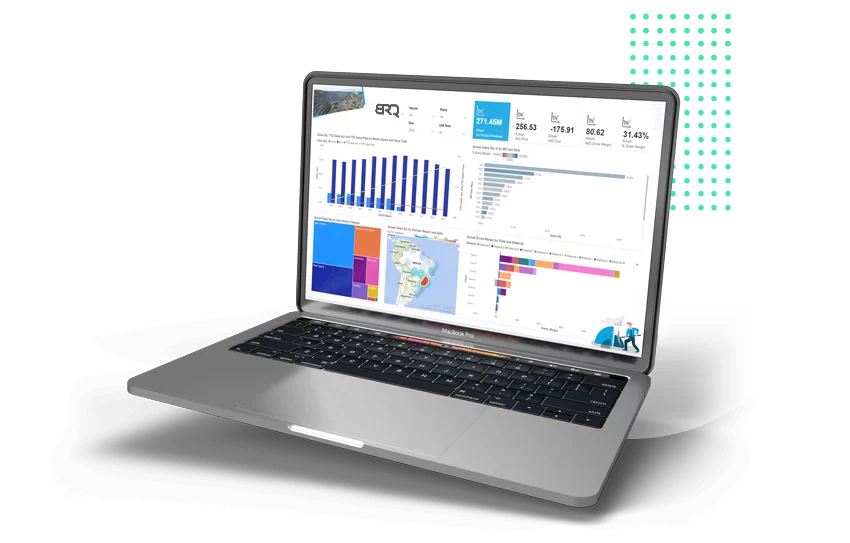
Mining Executive Summary
Example of Dashboard made for a mining company. Sales by distribution channels, margin by plant and material.
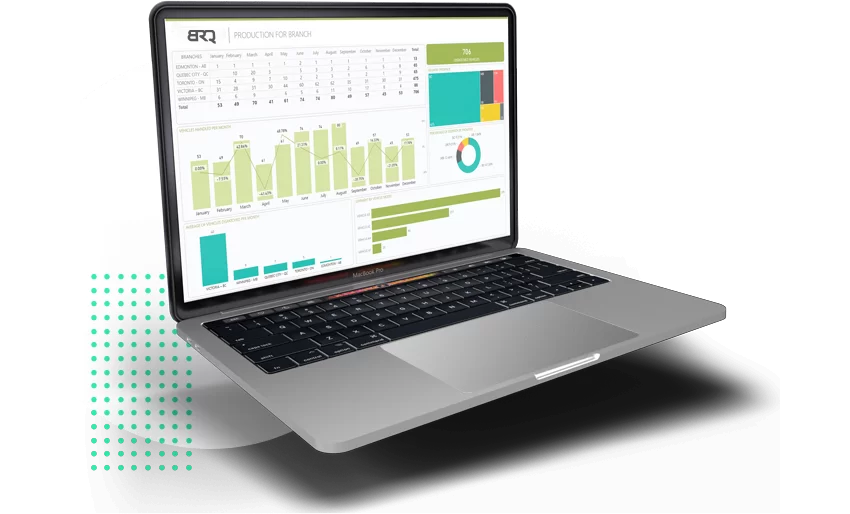
Logistics/Operations
Dashboard monitoring the logistics and operations of vechicles by company branch.
Our plans
Advanced
Dashboard
3 - 4 Dashboards*
Up to 10 charts*
Complex calculations
Payment in up to 3 installments
200 hours of dashboards development
Up to 3 months to consume the hours
$ 14,999.00
Small Control
Station
4 - 5 Dashboards*
Up to 18 charts*
Complex calculations
Payment in up to 4 installments
300 hours of dashboards development
Up to 6 months to consume the hours
$ 21,999.00
Control
Station
6 - 7 Dashboards*
Up to 24 charts*
Complex calculations
Payment in up to 5 installments
400 hours of dashboards development
Up to 8 months to consume the hours
$ 27,999.00
* We're assuming the data is BI-ready: information presented in the form of tables with rows and columns.
** Simple DAX formulas and Power Query M manipulations.
Our team
Business Analysts
They conduct the first meetings, understand the business and help to define the path to the best results.
Web Designers
They guarantee the best viewing experience for the dashboards, making them more appealing, easier to read and understand.
BI Specialists
They take care of your data, do the processing, do the modeling and ensure that you get valuable information.
Your project is in good hands.

BRQ Is Trusted by over 150 organizations across 8 countries

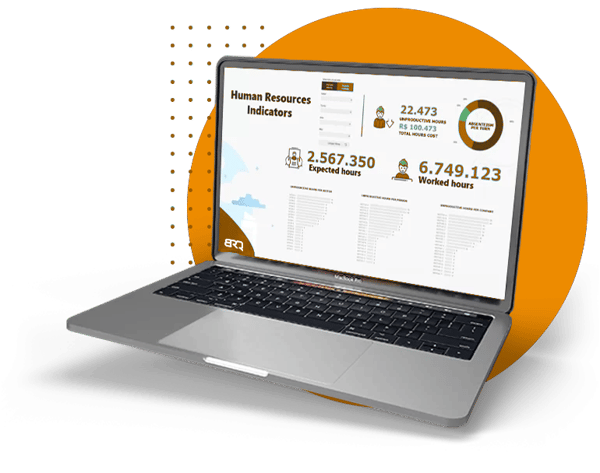
case Studies
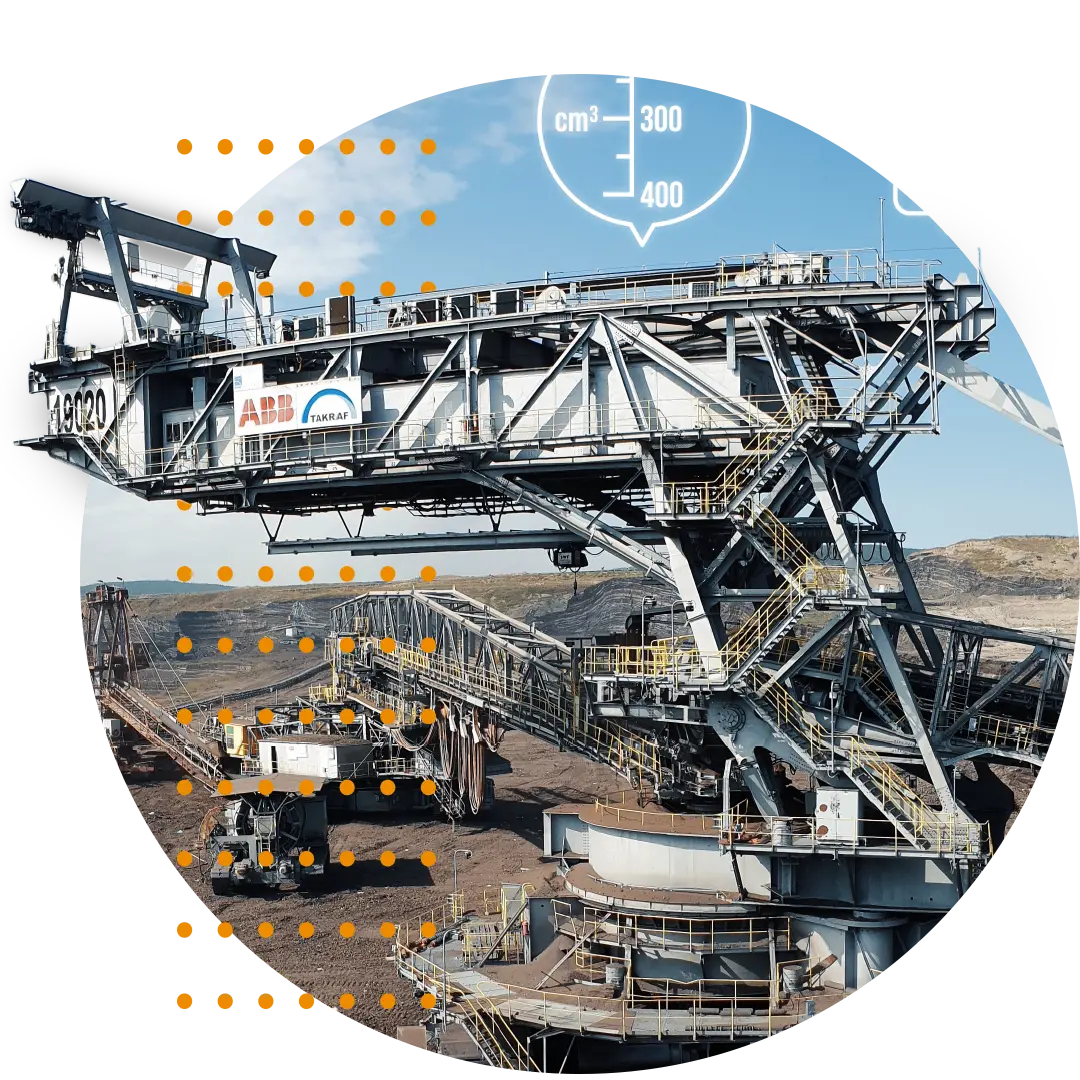
Aura
Minerals
Data analytics project for mining company ensures better data organization, visibility and safety.
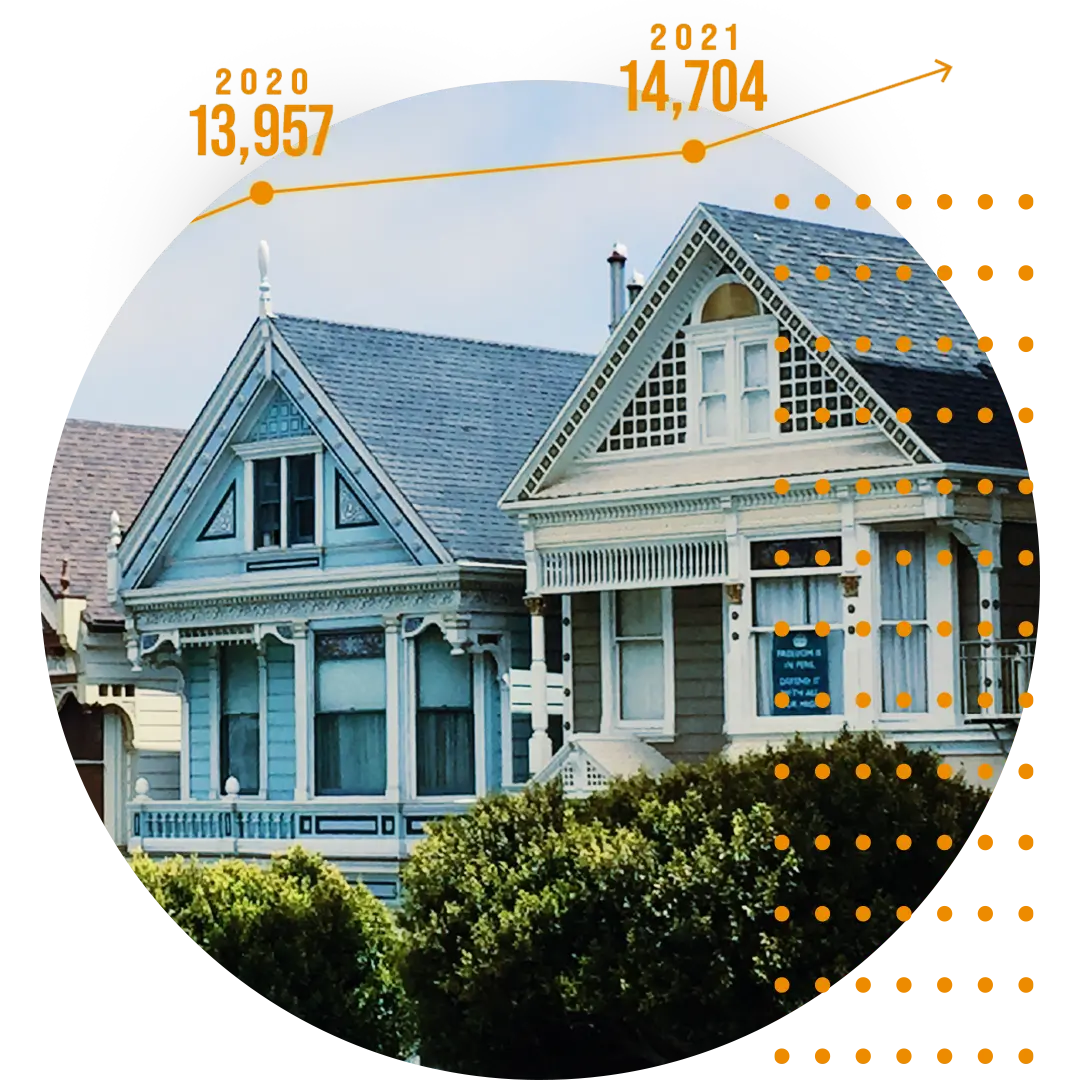
real Estate
client
How using data drove the business of a multinational real estate company.


